Investment Portfolio Tracker
Notice: plots and tables are currently disabled for mobile browsing. If you wish to view them, switch to a desktop or tablet.
Overview of the Plugin
The Investment Portfolio Tracker is an Elementor-integrated WordPress plugin designed for tracking and visualizing investment portfolios. It enables users to manage holdings, monitor price histories, update via APIs like Alpha Vantage, and generate dynamic charts and tables through Elementor widgets. Key features include real-time price fetching (with simulation fallback), FX rate handling, portfolio value calculations, and secure backup/restore options. This plugin simplifies investment oversight by combining admin tools for data management with frontend Elementor components for customizable displays. Its lightweight performance allow the plugin to run seamlessly on low-end systems like a Synology NAS.
Admin Panel
The plugin’s admin panel, accessible via the WordPress dashboard under “Portfolio Tracker,” provides comprehensive tools for managing portfolios. Below are the submenus and their features:
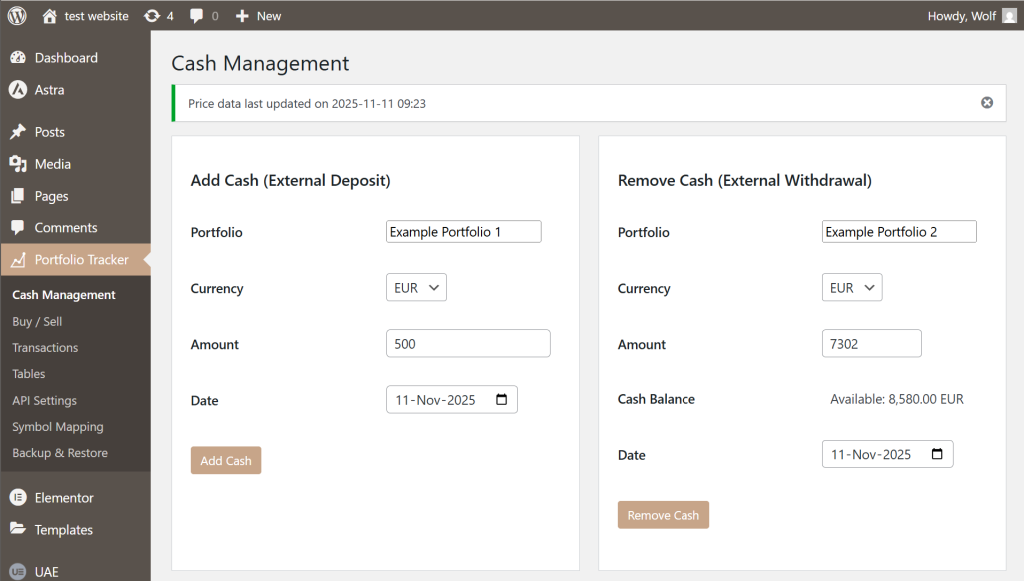
- Cash Management: Deposit or withdraw cash into any portfolio in multiple currencies, with live balance checks that guard against over-withdrawal and provide formatted availability feedback.
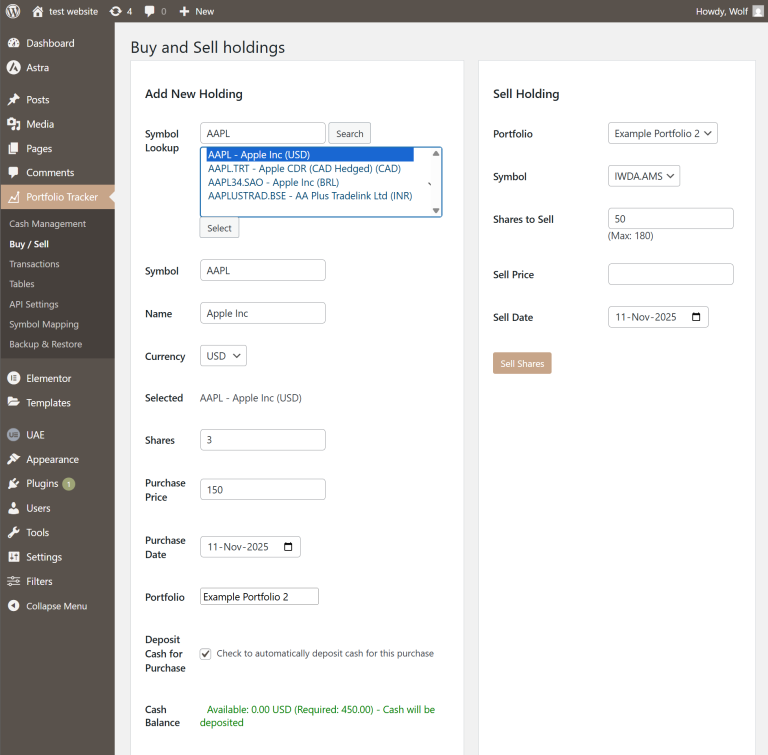
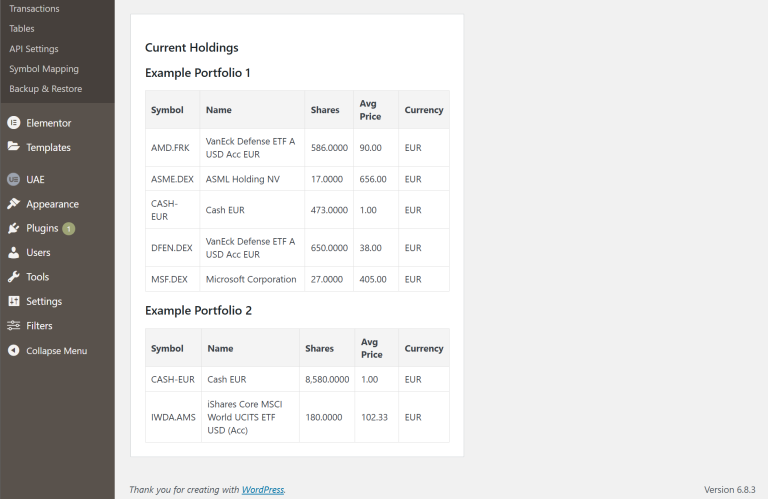
- Buy / Sell: Create or update holdings with symbol lookup, automatic name reuse, optional cash funding, and cash-balance warnings; sell orders enforce current position limits and feed a consolidated holdings table for review.
- Transactions: Review every transaction in sortable tables and adjust records via a modal editor that posts updates or deletes through AJAX, keeping the grid synchronized without leaving the page.

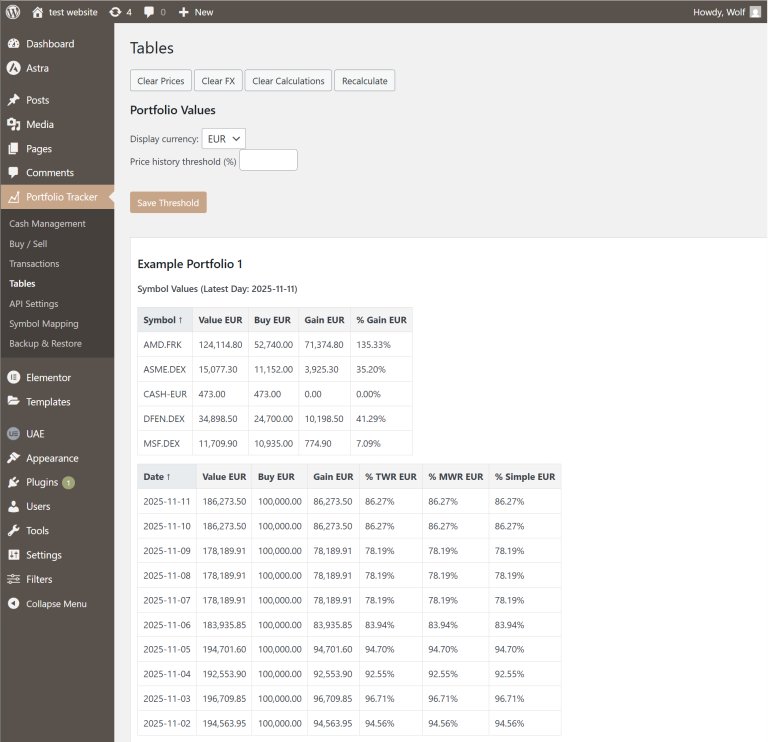
- Tables: Trigger mass maintenance (clear prices, FX, or calculations, or recompute values), switch currency visibility, set history-threshold options, and manually refresh quotes per symbol from contextual buttons.
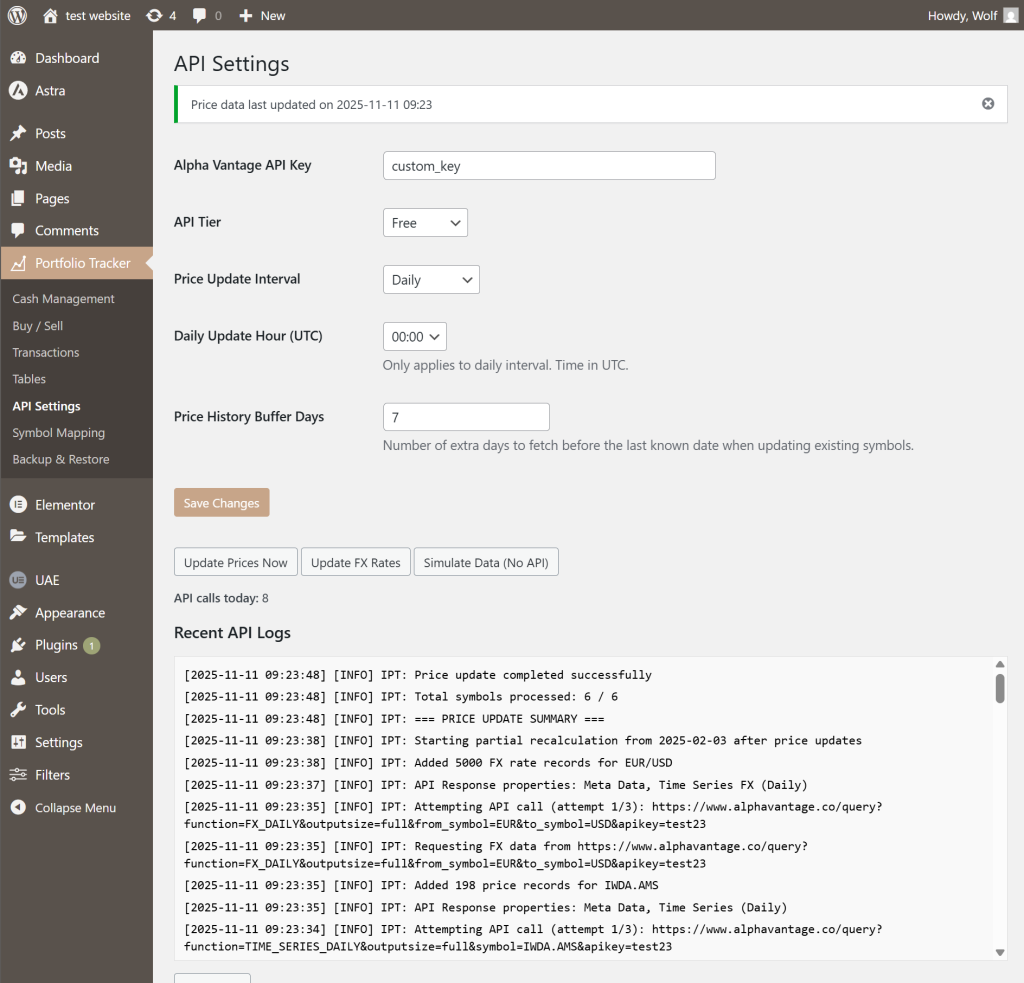
- API Settings: Capture Alpha Vantage credentials, tier, polling interval, update hour, and price-buffer days, then launch manual price/Fx refreshes or data simulations while reviewing and clearing recent API logs.
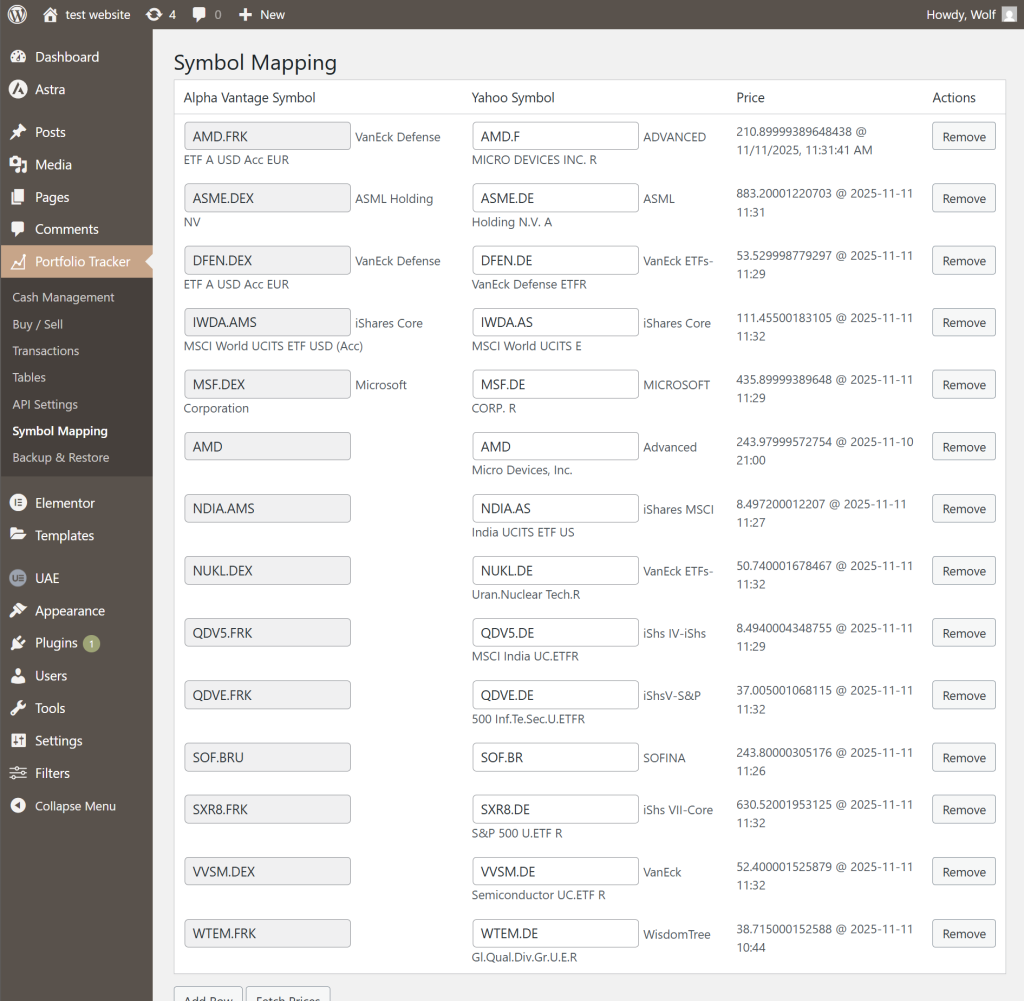
- Symbol Mapping: Maintain Alpha Vantage ↔ Yahoo! Finance symbol pairs with auto-complete, inline quote lookups, and row management; cash tickers are preserved silently to avoid clutter.
- Backup & Restore: Handles data export and import for security and migration. Users can download JSON backups for API data (prices/FX rates), transactions/portfolios, and computed values. Import forms allow uploading these JSON files, with automatic truncation and insertion while filtering irrelevant historical data based on holdings. Success/error notices appear post-import, ensuring reliable data management.

Elementor Widgets and Features
The plugin extends Elementor with custom widgets for interactive portfolio visualization. These widgets fetch data via AJAX and support responsive designs. Below are the widgets and their key features:
- Portfolio Live Summary Table: Summarizes current portfolio stats in a table. Controls: Column selection (invested, value, equities, percentage), portfolio repeater for ordering. Frontend: Static table with formatted numbers/percentages; auto-fetches latest data.
| Portfolio | Total Invested (€) | Current Value (€) | Number of Equities | Percentage Gain (%) | Daily Change (%) |
|---|
- Portfolio Daily Change: Display per-symbol daily performance for chosen portfolios with an optional “weight bars by allocation” toggle and responsive height control, including custom bar-thickness scaling on redraw.
- Portfolio Comparison: Compares multiple portfolios in a line chart. Controls: Select portfolios via repeater, default currency (USD/EUR), chart type (value/gain/percentage), height, zero-line styling. Frontend: Dropdowns for currency/type; chart shows historical data with tooltips (e.g., formatted values/percentages). Supports stacking and dynamic updates.
- Portfolio Pie Chart: Visualizes portfolio composition by symbols in pie charts. Controls: Portfolio repeater, currency, show details on hover (shares/value), pie size, grid columns/spacing. Frontend: Multi-pie grid (one per portfolio) with date slider; tooltips show shares/values; dynamic colors and no-data handling.
Example Portfolio 1
Example Portfolio 2
Portfolio Symbol Stacked: Stacks symbol values/gains in a line/area chart per portfolio. Controls: Portfolio repeater, default currency/type, height, zero-line styling. Frontend: Dropdowns for portfolio/currency/type/stacking (date/gain/percentage); interactive legend/tooltips with formatted values.